x10 Project
I was introduced to generative art by one of my college roommates, Norris. Since then, I’ve dabbled in Processing a couple of times but never got too far.
A couple of years ago, I wanted to pick Processing back up and I had the idea to create a generative art piece that would create Cruz Diez paintings. If you don’t know him, Cruz Diez is a Venezuelan artist famous for his chromatic cinetism. Being from Venezuela, I’m a fan and would love to own one of his paintings. The nice thing about them is that they lend themselves really well to generative art as they are for the most part patterns with some randomness thrown in them.
With the recent craze in NFTs, I’ve reconnected with my interest in generative art as there are now burgeoning marketplaces with amazing artists and projects. If you are not familiar, I would encourage you to visit artblocks or fxhash for some really awesome art (I got my hands on this awesome piece by d0n just last week!).
Given the growth in the space, I was inspired to pick back creative coding and bring my Cruz Diez project to life. It’s a good excuse to finally learn creative coding, bring my Cruz Diez project to life, and combine this with my interest in NFTs to experience it from the maker point of view.
This post will be a running log of my journey from noob to published NFT artist. I’ll document my raw learnings along the way, mainly for my self-reference, so apologies if it’s all mumbo jumbo to you!
Before we begin, you might be wondering why I’m naming this the x10 project? It’s simple: Cruz in spanish means cross. Diez, means 10. If Cruz Diez was an NFT artist, I can’t think of a better nickname for him than x10!
Idea log
I’ll keep a running list of ideas/thoughts at the top of the post:
- You can make cruz diez like paintings by trying to codify ina generative algorithm or by feeding ai a bunch of his images and then having the ai algorithm “paint” it. Maybe after i learn p5js I can teach myself how to do this with ai so i can compare the two.
Day 0 - Dec 22nd
What would making a Cruz Diez entail? Lets explore his paintings and try to come up with some pseudo code.
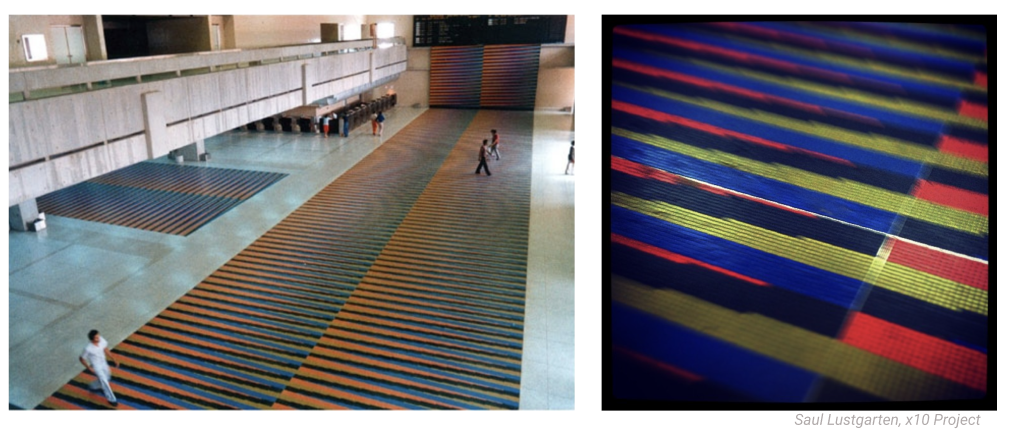
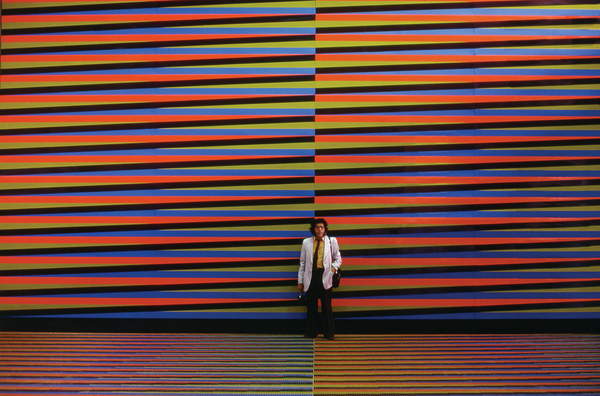
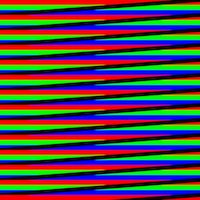
One of the most emblematic Cruz Diez works is the one displayed at Maiquetía, Venezuela’s International Airport, and with the mass migration of Venezuelan’s, it’s become a ritual to take a picture with it when you’re leaving the country.
Here is the artwork and here is the picture I took when I left:
To figure out what’s the algorithm making up the pattern, I’ll use Figma to break the pattern down:
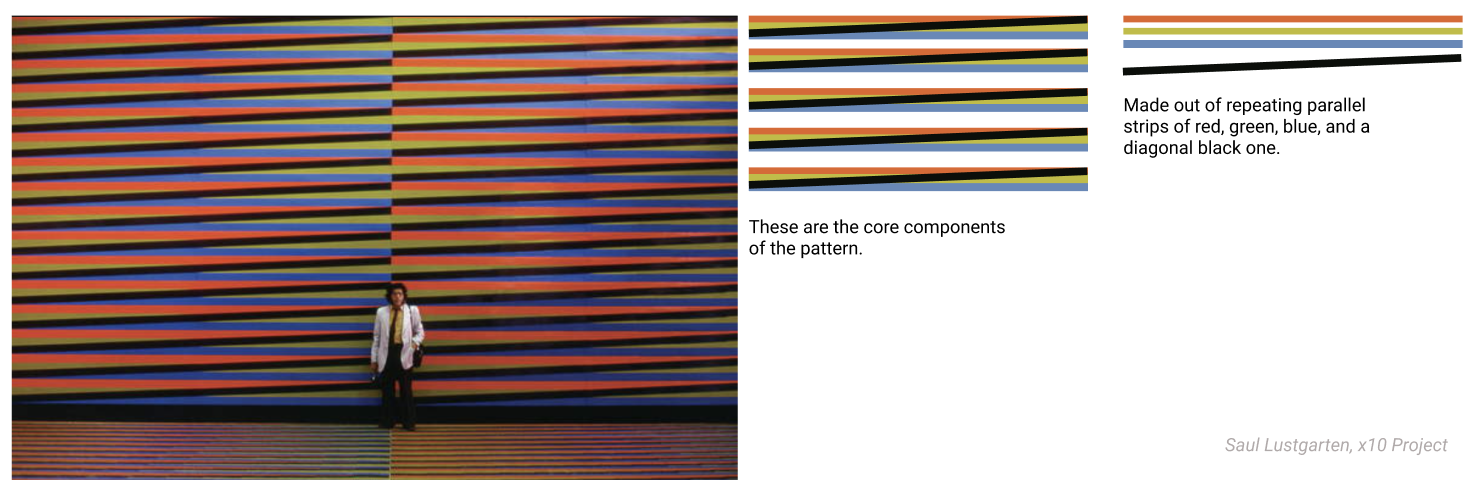
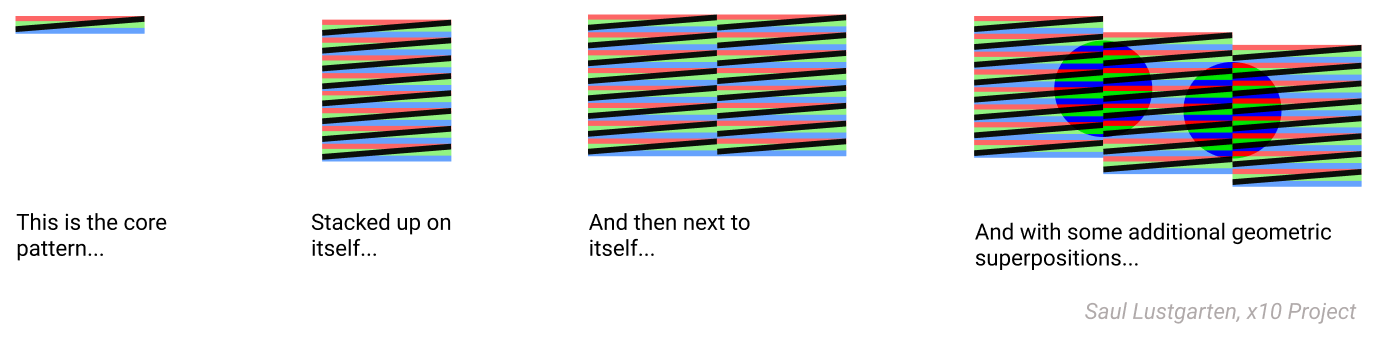
As you can see, the artwork can be decomposed into a main component of three parallel colored strips with a diagonal black one that is stacked again and again in multiple columns:
So the pseudo code for this would be something like:
for the width of the canvas:
    for the height of the canvas:
        create a red strip
        followed by a green one
        followed by a blue one
        followed by a diagonal black strip
end
Doesn’t look thaaat hard… and once I figure out how to do it, we can get creative with the strips and figures we superimpose.

But first, let’s get to the basics. How do I create that basic component with code?
Day 1 - Dec 24th
I was thinking of doing this project on Processing which is what I’ve tried in the past, but I finally decided to do it with P5.JS a javascript library for creative coding. As far as I can tell, it is inspired by Processing, but ‘rebooted’ for JS so it doesn’t use the same syntax and is built to be browser first.
In order to learn P5.js I looked at the project’s website and the excellent by Daniel Shiffman. I highly recommend them, he is quirky, energetic, and most importantly explain things very clearly.
Some key concepts from the first couple of videos are that the order in which you write the code in p5js matters, there is a flow. And also, whatever you put in the ‘setup’ section only happens once, while the draw section is getting regenerated every second.
After the 2.3 video, things started to click for me on using variables for creating a repeating pattern. Here are a couple of examples I came up with, some “studies”:
Day 2 - Dec 25th
Building on yesterday’s foundation, today I ventured to make a first Cruz Diez. I figured out that instead of trying to solve it with a for loop, I could do it with variables by repeating each color strip. Not an elegant code, but it works:
I thought this would be easy to replicate on a second column, but wasn’t that straightfoward:
For some reason I can’t get the columns to align. But if I make the strips the full width of the canvas, it looks like a real Cruz Diez!
There are some issues with the layering of the strips, however. If you look closely, the diagonal black lines are under the following colored strip, but the black ones should be on top of everything else.
Tomorrow I’ll figure out how to make the multiple columns and fix this layering issue.
On my mind: Even if I figure out how to come up with the right algorithm, I’ll need to figure out how to generate a number of copies that are sufficiently and interestingly different from each other.
Day 3 - Dec 26th
I woke up early today to catch up with some theory while everyone else is asleep:
https://youtu.be/-e5h4IGKZRY JS objects. Can get to the value inside with dot syntax. initialize variables in setup vs in draw vs before p5 functions are not available outside of setup and draw.
https://youtu.be/POn4cZ0jL-o random(min,max). always returns floating point. if you pick random value in setup, it only happens once. if you do it on draw, you’ll see it changing over and over. if you only give it one value it assumes the min is 0. windowWidth, windowHeight - can use these for filling up the available space of the window with the canvas. cool exampel of paint program where you draw and paint a rainbo: https://editor.p5js.org/Jaesar/sketches/fMuwjVCM6
https://youtu.be/nicMAoW6u1g map() - function that takes any range and maps value in that range to a value in another range. map takes 5 arguments = (value with current range that I want to map to new range, min of current range, max of current range, min of new range, max of new range)
https://youtu.be/TaluaAD9MKA createGraphics - you can create another canvas on top of existing one and make it transparent. This lets you have a layer where an object leaves a trail and another one where it doesn’t, for example. TO DO: Try to use this createGraphics to solve the layering issue I had yesterday later today (here is the code)
Introduction to conditional statements
Boolean Variables Events and boolean variables. Boolean variable you can use to check if an event has happened, and the event itself you want to use for when the event happens. mouseIsPressed function. Didn’t finish watching this.
While and for loops If you declare variable within a function, it’s a local variable.
for (let i = 0; i < 9; i++) {
  console.log(i);
}
From the p5js documentation: for creates a loop that is useful for executing one section of code multiple times.
- The first expression is a statement that is used to set the initial state for the loop.
- The second expression is a condition that you would like to check before each loop. If this expression returns false then the loop will exit.
- The third expression is executed at the end of each loop.
Shorthand:
x = x+50 <--> x += 50
x = x+1 <--> x++
Draw function is actually a for loop, so for loops are nested in the draw function. Stuff inside the for loop gets created every time the draw function loops.
Looking at the Cruz Diez artwork again, I realized that there is another approach to the work. Yesterday, I was trying to create columns of the little components. But today, I realized that the artwork can be deconstructed in a different way:
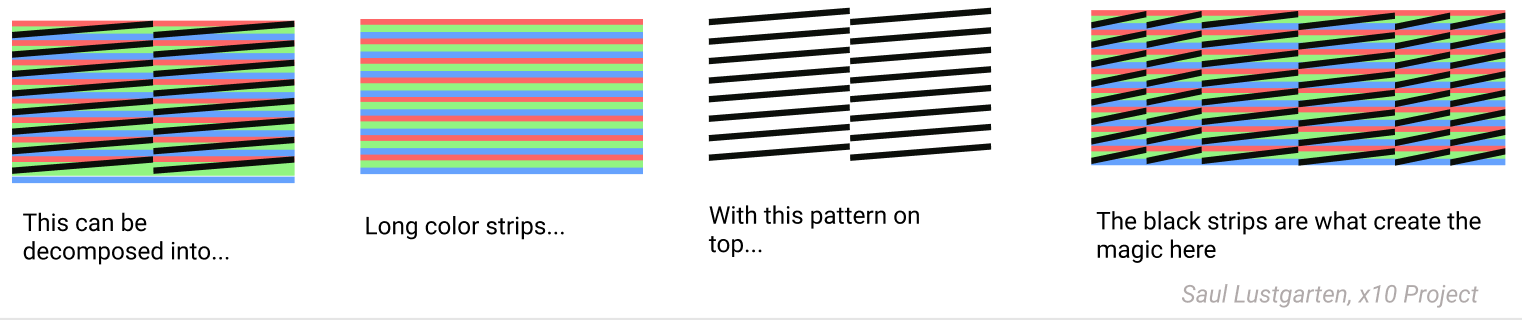
As you can see, the painting is composed of long colored strips and the repeating pattern are the black diagonal lines. I had completely failed to realize this until now - I fell for the optical illusion!
In any case, with this in mind, I can make use of the for loops to create a grid of this diagonals. If the grid’s columns are X and the grid’s rows are Y, you can think of this pseudo code as what we need to do:
for every x {
    for every y {
        draw diagonal
    }
}
Going back to yesterday’s code and adding the diagonals, after a couple of trials and errors… voilá - I got it to work!!!
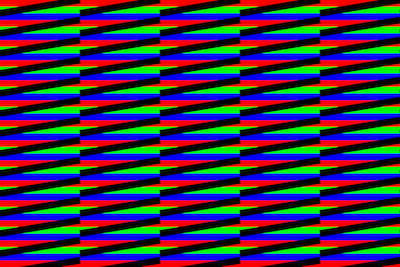
There you have it. An algorithmically generated Cruz Diez. What a beauty :-)
Now that I got the basics going, I need to look into makign it more interesting and unique. The point of generative art is to create something unique every time. I’ll try playing with the colors here:
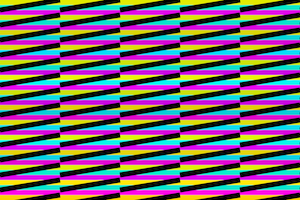
Play with the code here.
But I think what would make it really interesting would be to play with the lengths of the black strips, that’s where the magic happens. So up next I have to figure out how to create a grid pattern where every grid is not the same size, or an algorithm with some sort of randomness associated with it such that every time you run it you get a unique artwork.
TODO check this out: https://genekogan.com/code/p5js-transformations/
Day 4 - Jan 1st 2022
It’s been a couple of days since I was able to sit and work on this, but today I’m experimenting with randomness of the column size. On the original code, I had a static set of 5 columns so today I’m going to start by playing with a random number of columns.
var rectY = 0;
let color = 0;
var x = 0;

function setup() {
  createCanvas(600, 400);
  background(220);
}

function draw() {

  r = random(200,255);
  b = random(200,255);
  g = random(200,255);

// Play with rbg combinations below to change the colors. For a 'classic' cruz diez, leave first one (r,0,0), second (0,g,0), third (0,0,b)

  noStroke();
  fill(r,0,0);
  rect(0,rectY,width,10);
  rectY = rectY + 10;

  noStroke();
  fill(0,b,0);
  rect(0,rectY,width,10);
  rectY = rectY + 10;

  noStroke();
  fill(0,0,b);
  rect(0,rectY,width,20);
  rectY = rectY + 10;

  strokeWeight(10);
  // make the end of the line square instead of round
  strokeCap(SQUARE);
  stroke(0)

  var columns = floor(random(3,5))

  for (var x = 0; x <= width; x+=width/columns){
    for (var y = 0; y <= height; y+= 30) {
      line(x,20+y,x+width/columns,y);
    }
  }

}
I’m doing this with the columns variable, which sets the number of columns at a random number between 3 and 5 (rounded down).

For some reason it seems like the lines are being drawn twice.
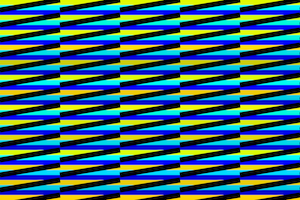
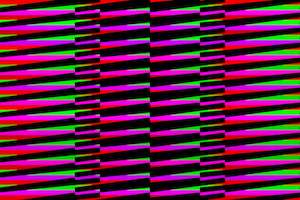
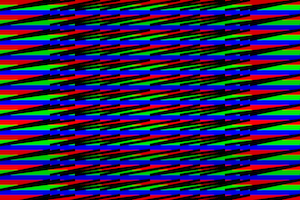
Changing the code a bit to have a random number of columns with random stroke size
     // random number of columns, random stroke size
    strokeWeight(random(1,4))
    var columns = floor(random(2,6))
    for (var x = 0; x <= width; x+=width/columns){
    for (var y = 0; y <= height; y+= 30) {
      line(x,y+30,x+width/columns,y);
    }
  }
This gives an interesting result:
    strokeWeight(random(2))
    var columns = 5 //floor(random(4,7))
    var spacing = width/columns
    for (var x = 0; x <= width; x+=spacing){
      for (var y = 0; y <= height; y+= 30) {
        line(x,y+40,x+spacing*random(),y);
   }
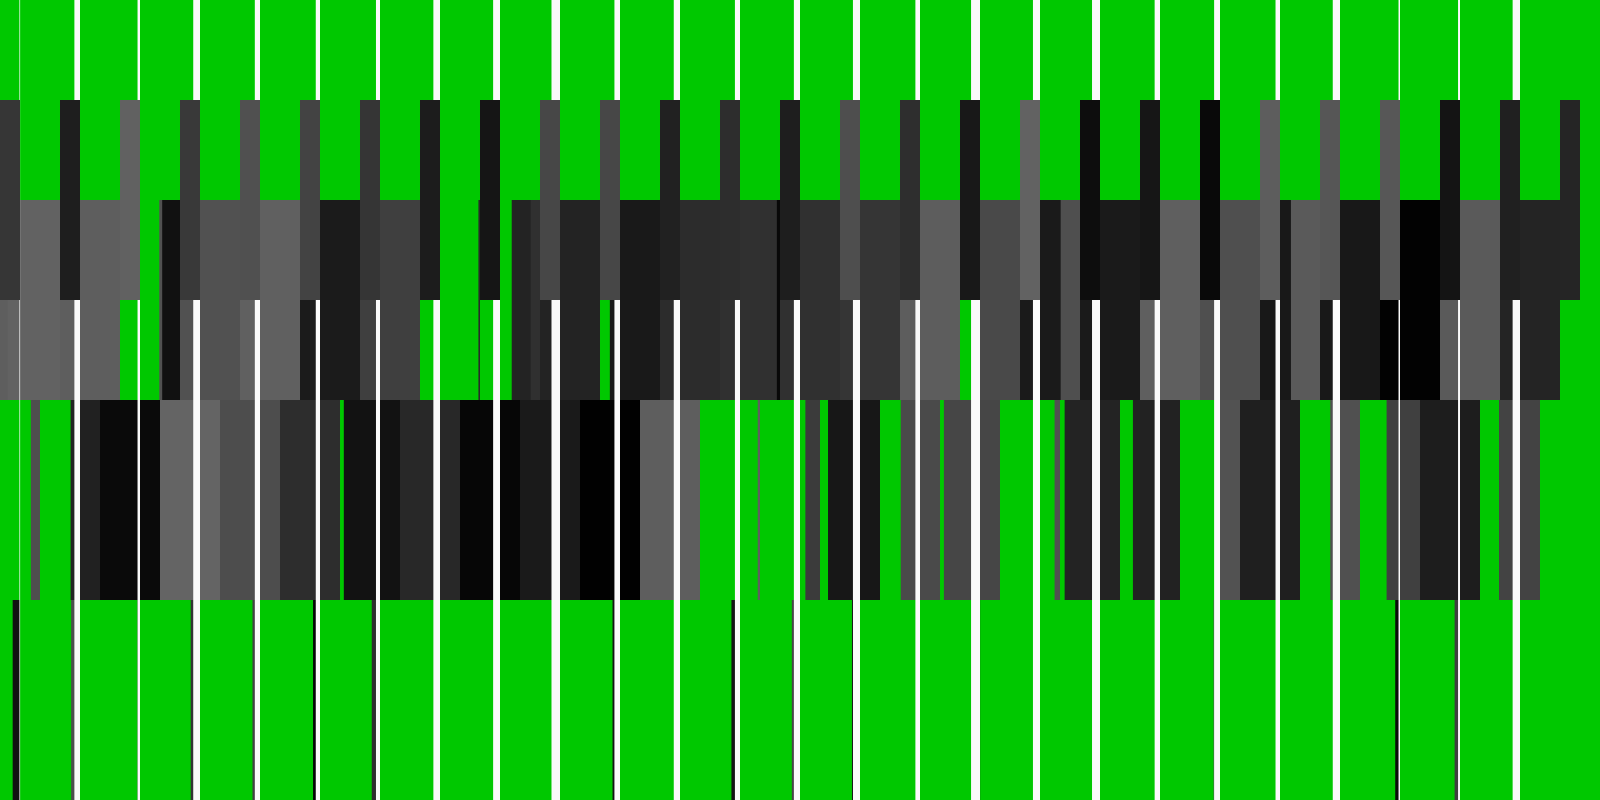
Looks like triangles, I kinda like it.
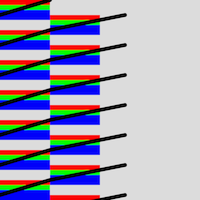
Something tells me my logic isn’t correct, because there seem to be many black strips on the same origin.
Looking at it without the background makes this clearer:
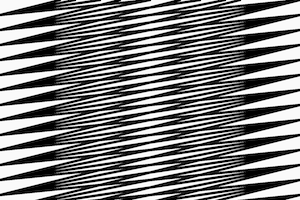
Increasing y1 in (x1,y1,x2,y2):
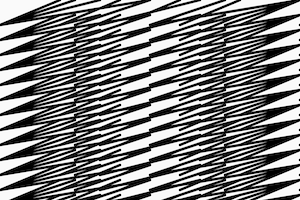
By drawing out the pattern, I figure out the for loop. Every line I draw has 2 coordinates: (x1,y1), and (x2,y2). What I want to accomplish is for every row, I hold the Ys constant and the only thing that changes are the X. The first line gets drawn, then the second line has a different X1 starting on the X2 of the first line, and an X2 that I’d like to shift by the length of the line. Since I want that length to change over time, I turned it into a vaeriable and I increase it every time we go through the loop:
  // increasing length of black strips, exponentially
  strokeWeight(7)
  strokeCap(SQUARE) // make the end of the line square instead of round
  var length = 5;
  for (var x = 0; x <= width; x+=length){
    length = length*1.5;
    for (var y = 0; y <= height; y+= 30) {
      line(x,20+y,x+length,y);
      //length += 10;
    }
  }
Here is how it looks:
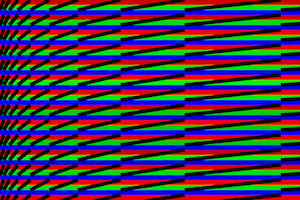
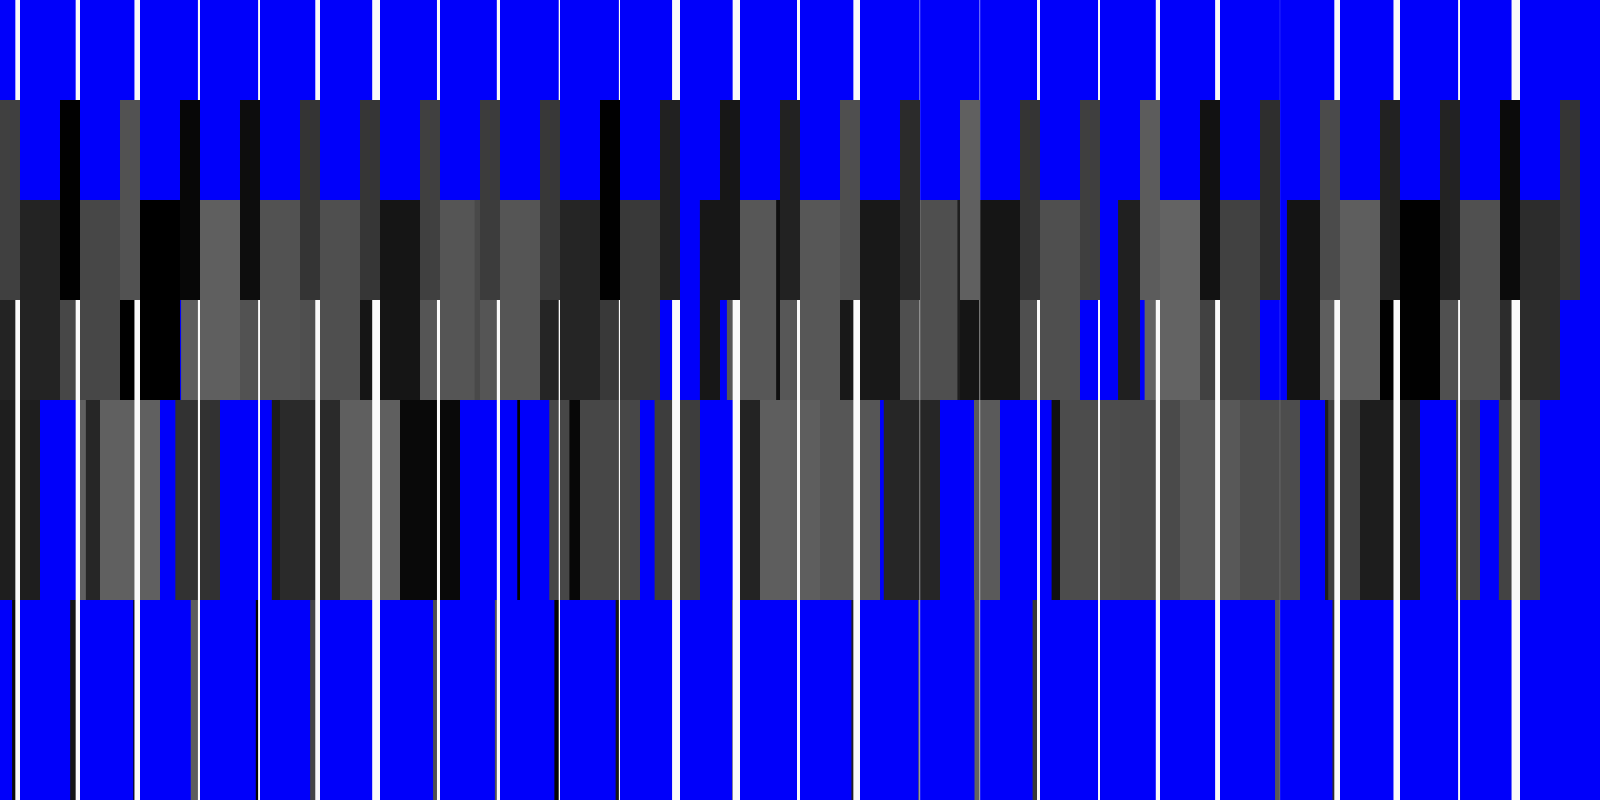
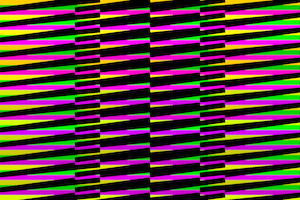
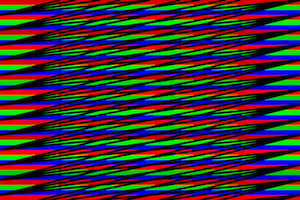
Now I’d like to change the pattern. I played around with usnig an IF statement to change the formula that drives the length:
  // increasing length of black strips until half width, then stay constant
  strokeWeight(6)
  strokeCap(SQUARE) // make the end of the line square instead of round
  var length = 5;
  for (var x = 0; x <= width; x+=length){
    if(x<width/2){
      length = length*1.5;
    } else {
      length = 100;
    }
    for (var y = 0; y <= height; y+= 30) {
      line(x,20+y,x+length,y);

    }
  }
Here is the result:
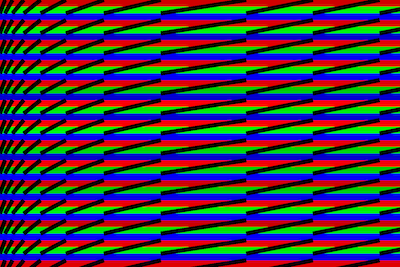
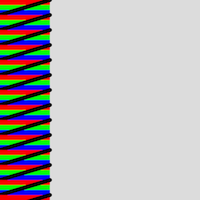
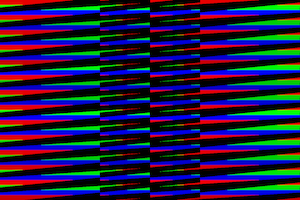
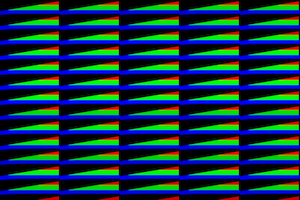
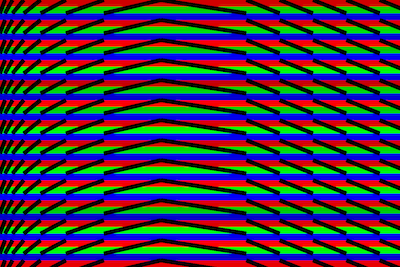
As a next iteration it would be cool if the length starts decreasing or if the line changes direction so it’s downward sloping after a certain point. I can accomplish this with an IF statement on the formula for the line:
// increasing length of black strips until half width, then stay constant but make downward sloping
  strokeWeight(6)
  strokeCap(SQUARE) // make the end of the line square instead of round
  var length = 5;
  for (var x = 0; x <= width; x+=length){
    if(x<width/2){
      length = length*1.5;
    } else {
      length = 50;
    }
    for (var y = 0; y <= height; y+= 30) {
      // Define when the slope changes
      if (x<width/3){
        line(x,20+y,x+length,y);
      } else {
        line(x,y,x+length,y+20);
      }

    }
  }
Here is how it looks (you can vary the if condition so that it happens earlier or later)
Before logging off for the day, I found out there is this thing called (Genuary)[https://genuary.art/] and it starts today with the prompt “Draw 10,000 of something”.